

|
|
|||
|
Published Friday, June 11, 2021 at: 8:59 PM EDT


The Standard & Poor’s 500 stock index closed at a record high 4247.44 today. Which begs the question: What do you expect from stocks for the rest of 2021? Here are three scenarios for how the rest of 2021 could look, as inflation uncertainty grows and a booming expansion is about to begin.

To understand the current financial economic situation, picture Americans sitting on a mountain of cash. As a matter of fact, the cash was financed by government stimulus payments and extra unemployment benefits in response to the pandemic.
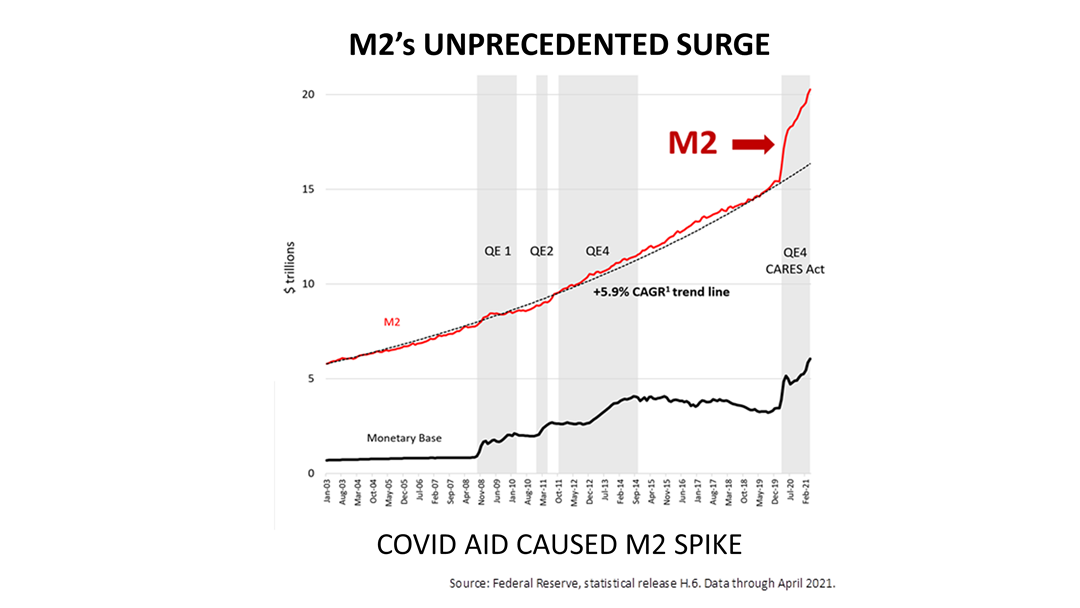
The unprecedented cash spike looks like this: the latest figures on M2, also known as “money supply,” from the U.S. Federal Reserve Bank. Money in savings and money market accounts is literally off the charts compared to history!
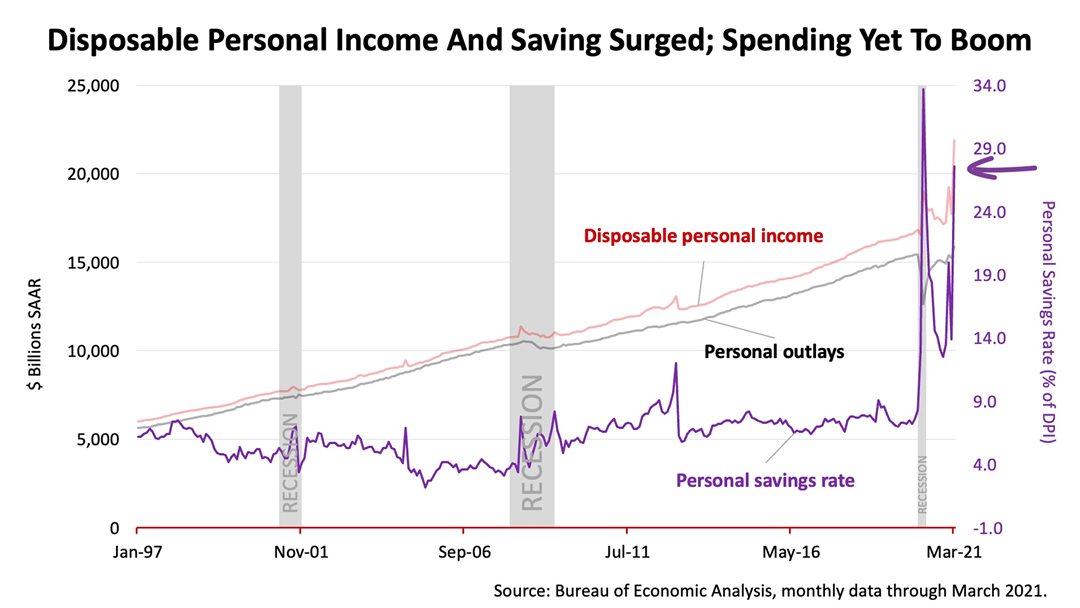
Further evidence of the unprecedented cash hoard is in the purple line of the chart above. The savings rate remains at more than twice the normal rate pre-pandemic!
The savings hoard is about to be tapped as normalcy returns in the days ahead. It will unleash a consumer boom and has already begun driving prices higher for goods as services.
Herein lies the rub: Inflation uncertainty could compress high current stock valuations.
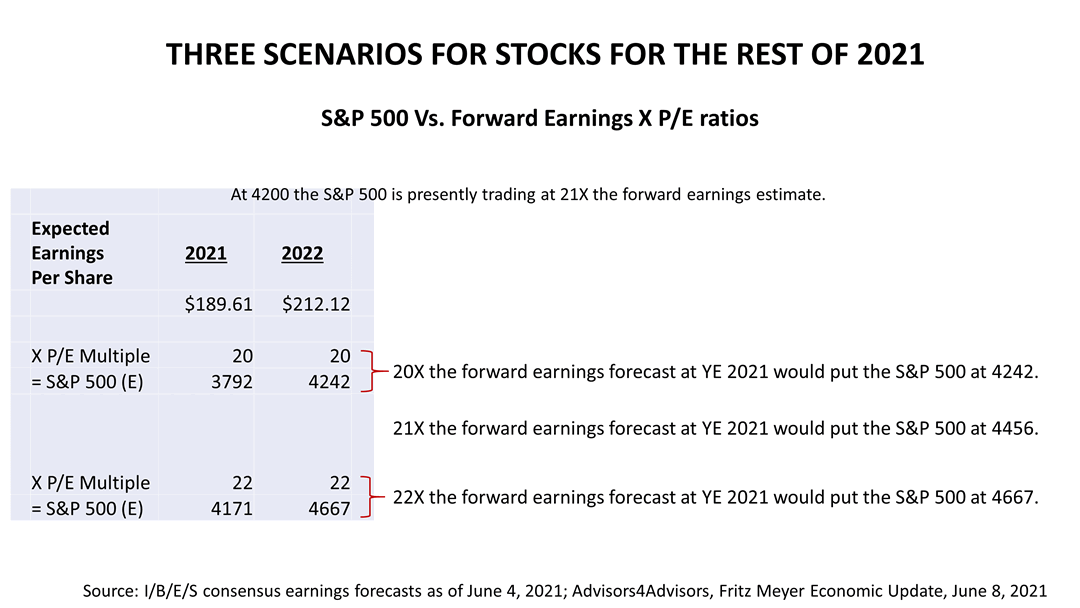
According to independent economist Fritz Meyer, whose news feed we license, if p-e ratios are compressed by inflation fears and drop from the current price-earnings multiple of 21 to 20 between now and the end 2021, the S&P 500 would close the year at 4242, which is about where it closed today. He says this is the most likely scenario for the second half of 2021.
However, Mr. Meyer was quick to add that reliably predicting markets near-term ups and downs is impossible and he provided two more optimistic scenarios for the stock market for the rest of 2021:
If the forward-looking p-e multiple stays the same, at 21, the S&P at the end of 2021 would close at 4456 – more than 4% higher than today’s closing price.
If the forward-looking p-e multiple rises to 22, the S&P at the end of 2021 would close at 4667 – more than 8% higher than today’s closing price.
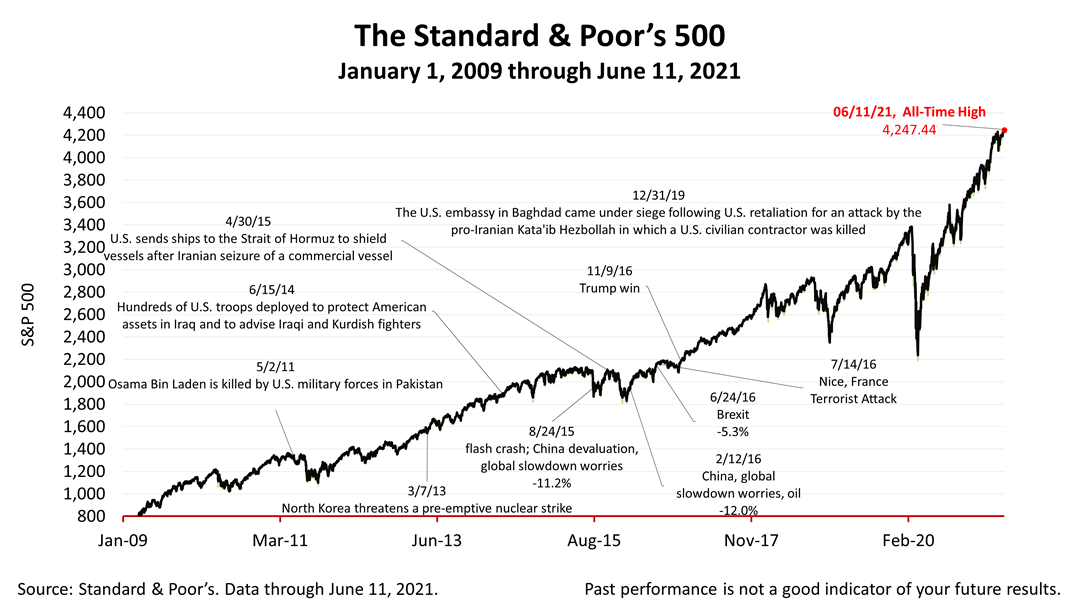
The Standard & Poor’s 500 stock index squeaked to close at a new record high of 4,247.44 Friday, by gaining +0.19%. Up a slim +0.41% from last Friday’s closing price. The index is up +61.99% from the March 23rd bear market low.
Stocks are the growth engine and also the asset that generally causes the most fear in a long-term investor’s portfolio.
Here are the 2021 and 2022 estimated S&P 500 operating earnings per share referenced above, as of June 4, 2021: For 2021 the estimate is for earnings of $189.61 on the S&P 500; and $212.12 in 2022. Sources: Yardeni Research, Inc. and Thomson Reuters I/B/E/S for estimated operating earnings from 2015.
Nothing contained herein is to be considered a solicitation, research material, an investment recommendation, or advice of any kind, and it is subject to change without notice. Any investments or strategies referenced herein do not take into account the investment objectives, financial situation or particular needs of any specific person. Product suitability must be independently determined for each individual investor. Tax advice always depends on your particular personal situation and preferences. You should consult the appropriate financial professional regarding your specific circumstances. The material represents an assessment of financial, economic and tax law at a specific point in time and is not intended to be a forecast of future events or a guarantee of future results. Forward-looking statements are subject to certain risks and uncertainties. Actual results, performance, or achievements may differ materially from those expressed or implied. Information is based on data gathered from what we believe are reliable sources. It is not guaranteed as to accuracy, does not purport to be complete, and is not intended to be used as a primary basis for investment decisions. This article was written by a professional financial journalist for Advisor Products and is not intended as legal or investment advice.
This article was written by a professional financial journalist for Preferred NY Financial Group,LLC and is not intended as legal or investment advice.
An individual retirement account (IRA) allows individuals to direct pretax incom, up to specific annual limits, toward retirements that can grow tax-deferred (no capital gains or dividend income is taxed). Individual taxpayers are allowed to contribute 100% of compensation up to a specified maximum dollar amount to their Tranditional IRA. Contributions to the Tranditional IRA may be tax-deductible depending on the taxpayer's income, tax-filling status and other factors. Taxed must be paid upon withdrawal of any deducted contributions plus earnings and on the earnings from your non-deducted contributions. Prior to age 59%, distributions may be taken for certain reasons without incurring a 10 percent penalty on earnings. None of the information in this document should be considered tax or legal advice. Please consult with your legal or tax advisor for more information concerning your individual situation.
Contributions to a Roth IRA are not tax deductible and these is no mandatory distribution age. All earnings and principal are tax free if rules and regulations are followed. Eligibility for a Roth account depends on income. Principal contributions can be withdrawn any time without penalty (subject to some minimal conditions).
©2021 Advisor Products Inc. All Rights Reserved.

Not found any published videos!

Jericho Atrium, 500 N Broadway # 219
Jericho, NY 11753
Phone: +1 516-935-3434
Fax: 516-935-3454